 Facebook
 X
X
 Pinterest
 Copy Link


The following analysis of select counties of the Idaho real estate market is provided by Windermere Real Estate Chief Economist Matthew Gardner. We hope that this information may assist you with making better-informed real estate decisions. For further information about the housing market in your area, please don’t hesitate to contact your Windermere Real Estate agent.
REGIONAL ECONOMIC OVERVIEW
On top of having recovered all the jobs lost to COVID-19 by the end of 2020—a remarkable feat in itself—the Idaho economy continues to strengthen. Current employment levels are up by 15,400 jobs from the pre-pandemic peak. With the labor market continuing to expand, the unemployment rate was 2.9% in August (the most recent data available). Equally impressive was that the rate dropped even as the labor force grew—no easy task. New COVID-19 cases remain higher than I would like, but this does not appear to have impacted the state’s economy to any significant degree given the robust employment picture. As we move, hopefully, toward a time when the impacts of the pandemic wane further, I see nothing but an upward trajectory for the state’s economy.
IDAHO HOME SALES
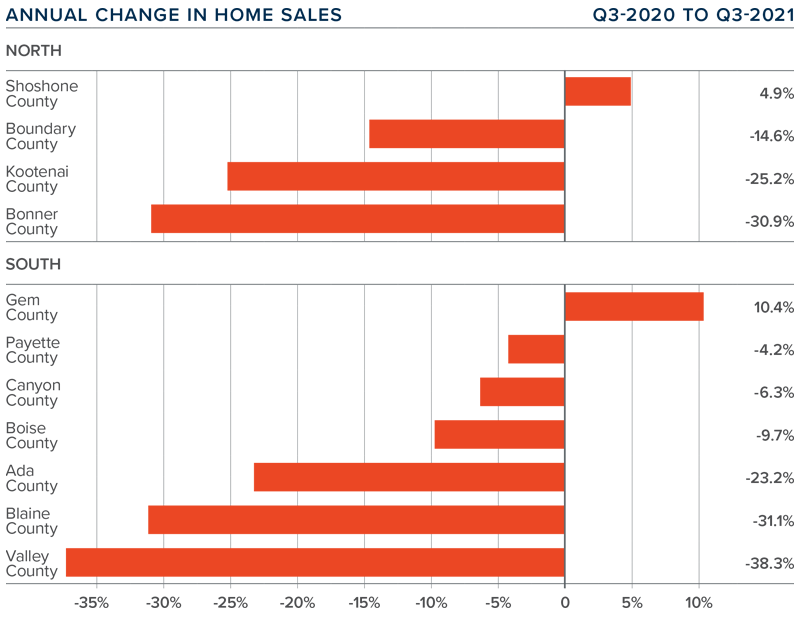
❱ In the third quarter, 7,354 existing homes sold, representing a drop of 19.9% from a year ago. However, given that the country was experiencing a massive housing rebound following the outbreak of COVID-19, any comparison with data from 12 months ago is not very informative. More useful is that sales rose 22.1% compared to the second quarter of 2021.
❱ As mentioned, comparing current data to a year ago does not provide an accurate picture, but comparing it with the second quarter data shows sales higher across the board. Sales were up by double digits in every county covered by this report.
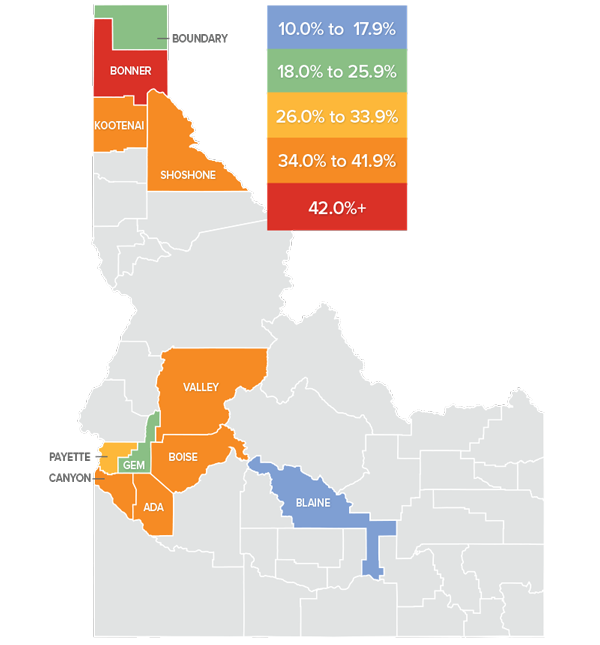
❱ Year-over-year sales improved in Shoshone County in Northern Idaho. Sales also rose in Gem County in the southern part of the state.
❱ Pending sales rose 16.5% from the second quarter of 2021, suggesting that closed sales in the final quarter of the year are also likely to show improvement from current levels. This is also supported by the fact that listing inventory has risen almost 36%. I predict more listings will lead to more sales.
IDAHO HOME PRICES
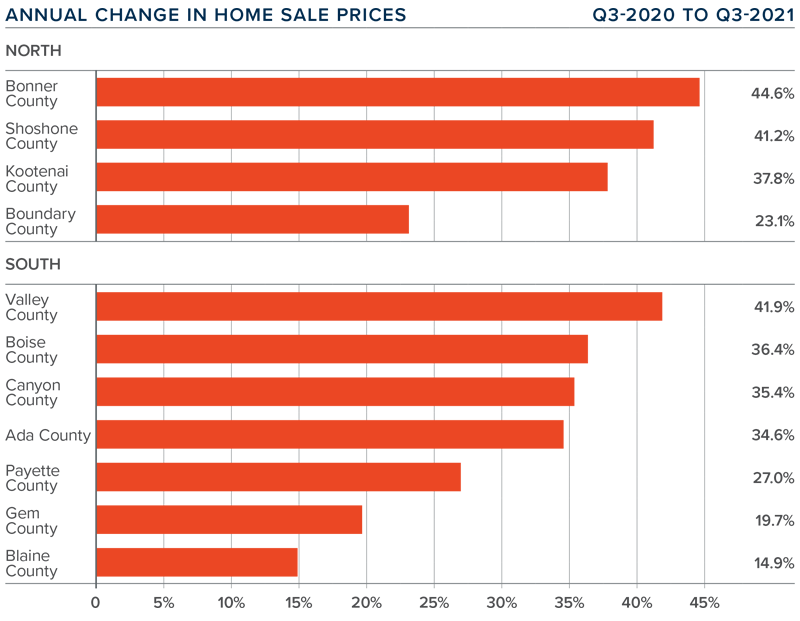
❱ The average home price in the region rose 30.9% year over year to $603,066. Prices were also up 8% compared to the second quarter of this year.
❱ Compared to the previous quarter, home prices were up 8.9% in both the northern and southern counties in this report. Sizable gains were seen in Shoshone County (+33.7%) and Bonner County (+22.7%) in the north, and Valley County (+22.6%) and Blaine County (+17.2%) in the south.
❱ Prices rose by double-digits across the board. Sale prices were up 37% in the North Idaho counties covered by this report, and up 27.7% in the southern counties.
❱ With far more buyers than sellers, home prices continue their upward march. As prices are rising at a far faster pace than wages, this cannot continue indefinitely. I expect to see the pace of appreciation start to slow, but probably not until next year.
DAYS ON MARKET
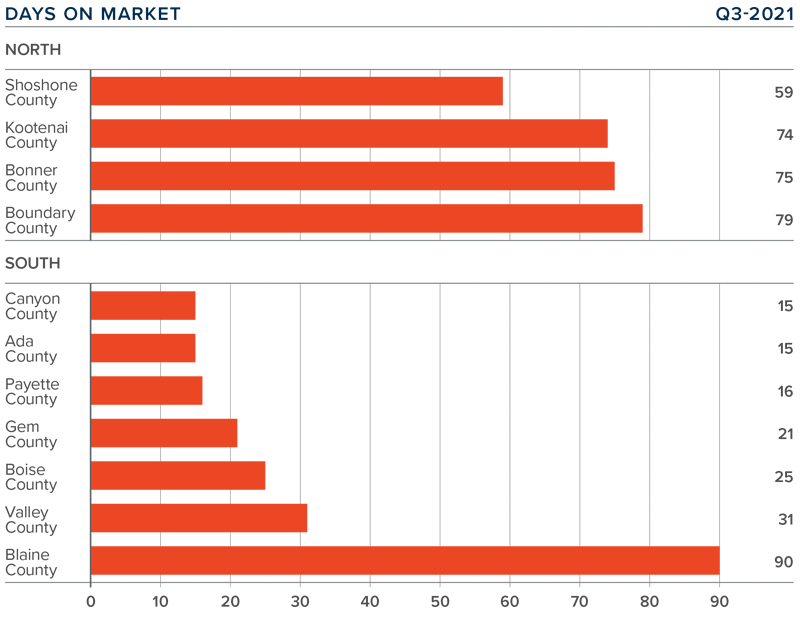
❱ It took an average of 72 days to sell a home in Northern Idaho, and 31 days in the southern part of the state.
❱ The average number of days it took to sell a home in the region dropped 23 days compared to the third quarter of 2020 but rose 2 days compared to the second quarter of this year.
❱ In Northern Idaho, days on market dropped in all counties versus a year ago but rose in all counties compared to the second quarter of this year. Market time in Southern Idaho was also lower than a year ago, but it was up from the prior quarter in Valley, Gem, and Blaine counties.
❱ Homes sold the fastest in Ada and Canyon counties in the southern part of the state. Sales were again fastest in Shoshone County in the northern part of the state.
CONCLUSIONS
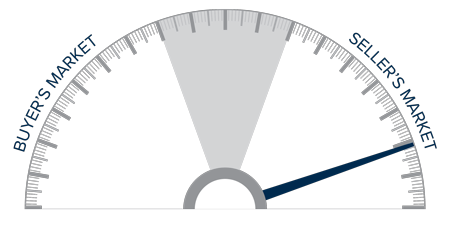
This speedometer reflects the state of the region’s real estate market using housing inventory, price gains, home sales, interest rates, and larger economic factors.
Idaho’s economy appears to be powering forward and job recovery is well ahead of almost every other state. The result is clearly an increasing number of buyers who feel comfortable buying a new home, even given the dramatic price growth of late.
That said, the only factors favoring buyers right now are that there are significantly more homes to choose from and mortgage rates remain very low by historic standards. All other factors support sellers more than buyers. As such, I am moving the needle a little more in their favor, even as affordability concerns continue to rise.
ABOUT MATTHEW GARDNER

As Chief Economist for Windermere Real Estate, Matthew Gardner is responsible for analyzing and interpreting economic data and its impact on the real estate market on both a local and national level. Matthew has over 30 years of professional experience both in the U.S. and U.K.
In addition to his day-to-day responsibilities, Matthew sits on the Washington State Governors Council of Economic Advisors; chairs the Board of Trustees at the Washington Center for Real Estate Research at the University of Washington; and is an Advisory Board Member at the Runstad Center for Real Estate Studies at the University of Washington where he also lectures in real estate economics.
