 |
The following analysis of select counties of the Idaho real estate market is provided by Windermere Real Estate Chief Economist Matthew Gardner. We hope that this information may assist you with making better-informed real estate decisions. For further information about the housing market in your area, please don’t hesitate to contact us.
ECONOMIC OVERVIEW In August, the state unemployment rate was 2.9%, marginally higher than the 2.8% rate a year ago. It cannot be disputed that the state remains at full employment. It’s also interesting to note that the employment rate remained below 3% even as the labor force rose by 2.2%, suggesting that the economy remains very strong and new entrants to the labor force are finding jobs relatively easily. |
|
|
| HOME SALES | ANNUAL CHANGE IN HOME SALES Q3-2018 TO Q3-2019 |
| ❱ During the third quarter, 7,342 homes sold, representing a modest drop of 3.4% compared to the third quarter of 2018.
❱ In Northern Idaho, Shoshone County experienced a 17.9% increase in sales over the third quarter of 2018. There was a modest increase in Bonner County and a very slight contraction in Kootenai County. In Southern Idaho, sales jumped in Boise and Canyon counties. Blaine County also saw a slight increase, but sales activity was lower in the rest ❱ Year-over-year sales growth was positive in two Northern Idaho counties and three Southern Idaho counties. ❱ Pending sales rose in the third quarter, suggesting that closed sales in the final quarter of this year are likely to be an improvement over current figures. |
 |
HOME PRICES
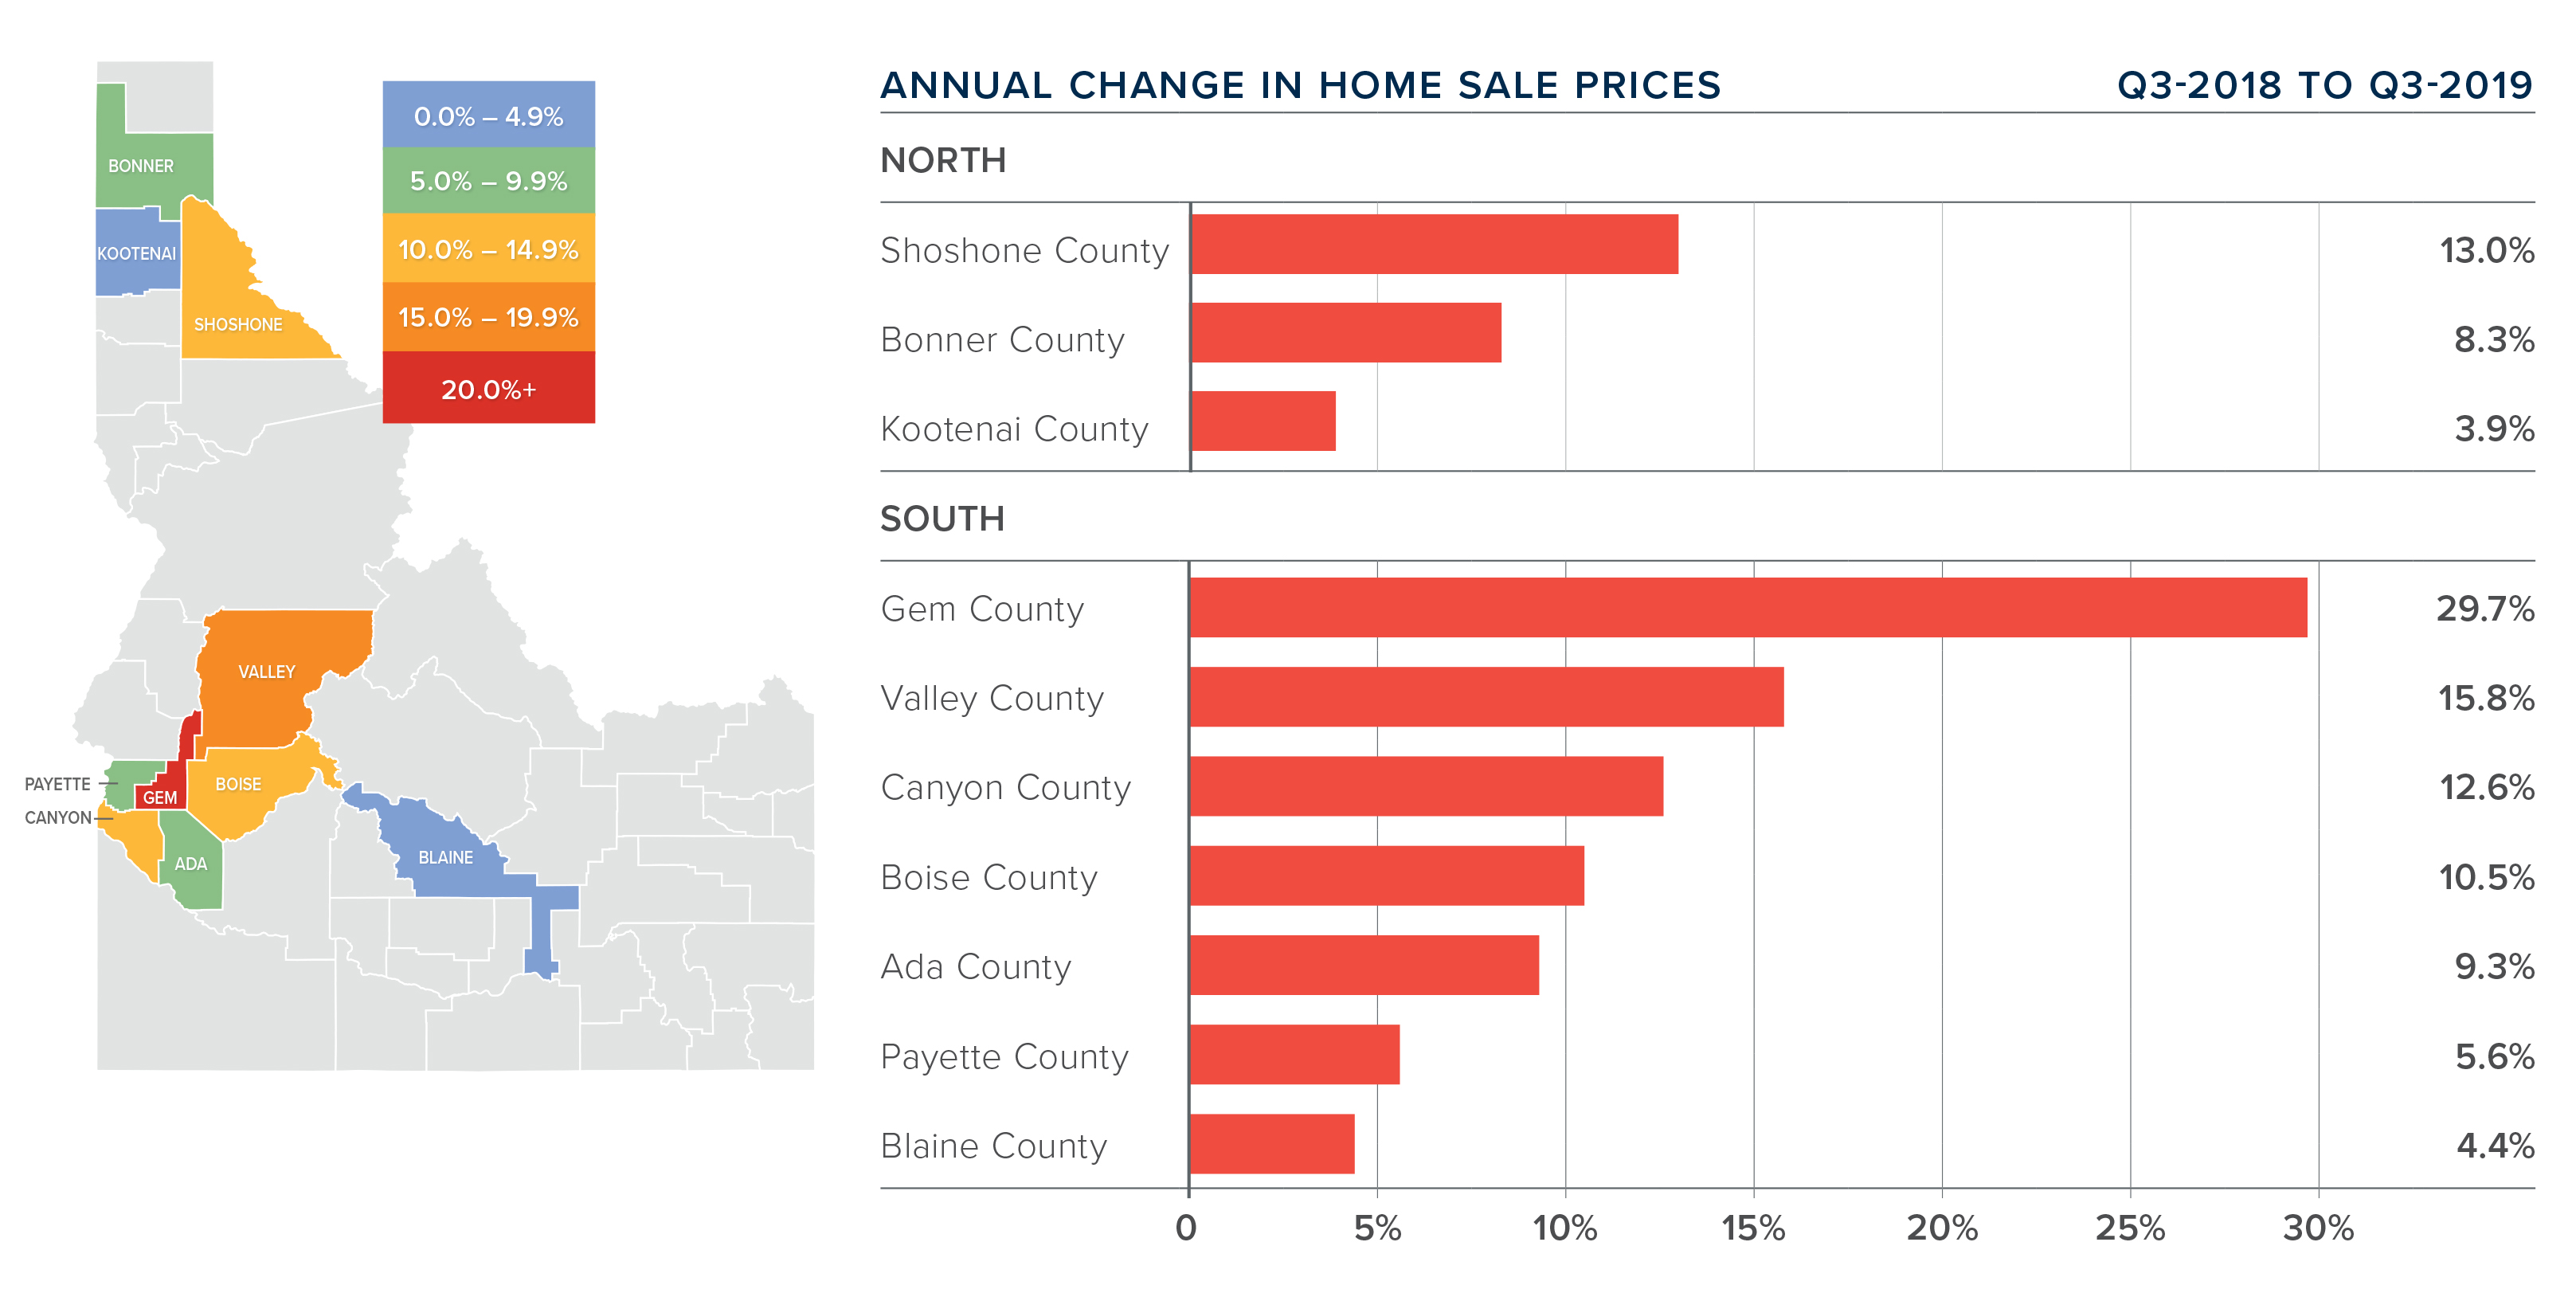
| ❱ The average home price in the region rose 8% year-over-year to $367,963. Prices were 2.7% higher than in the second quarter of this year. ❱ Prices rose in all counties compared to the third quarter of 2018. |
❱ In Northern Idaho, Shoshone County led the market with the strongest annual price growth. Bonner County also had solid price growth. In Southern Idaho, Gem County saw prices rise a very significant 29.7%, and there were notable increases in Valley, Canyon, and Boise counties. | ❱ Inventory continues to be an issue. The number of homes for sale is down 3.4% compared to the third quarter of 2018. Although listings are up 7% over the second quarter, the market remains very tight, and this is pushing prices higher. |
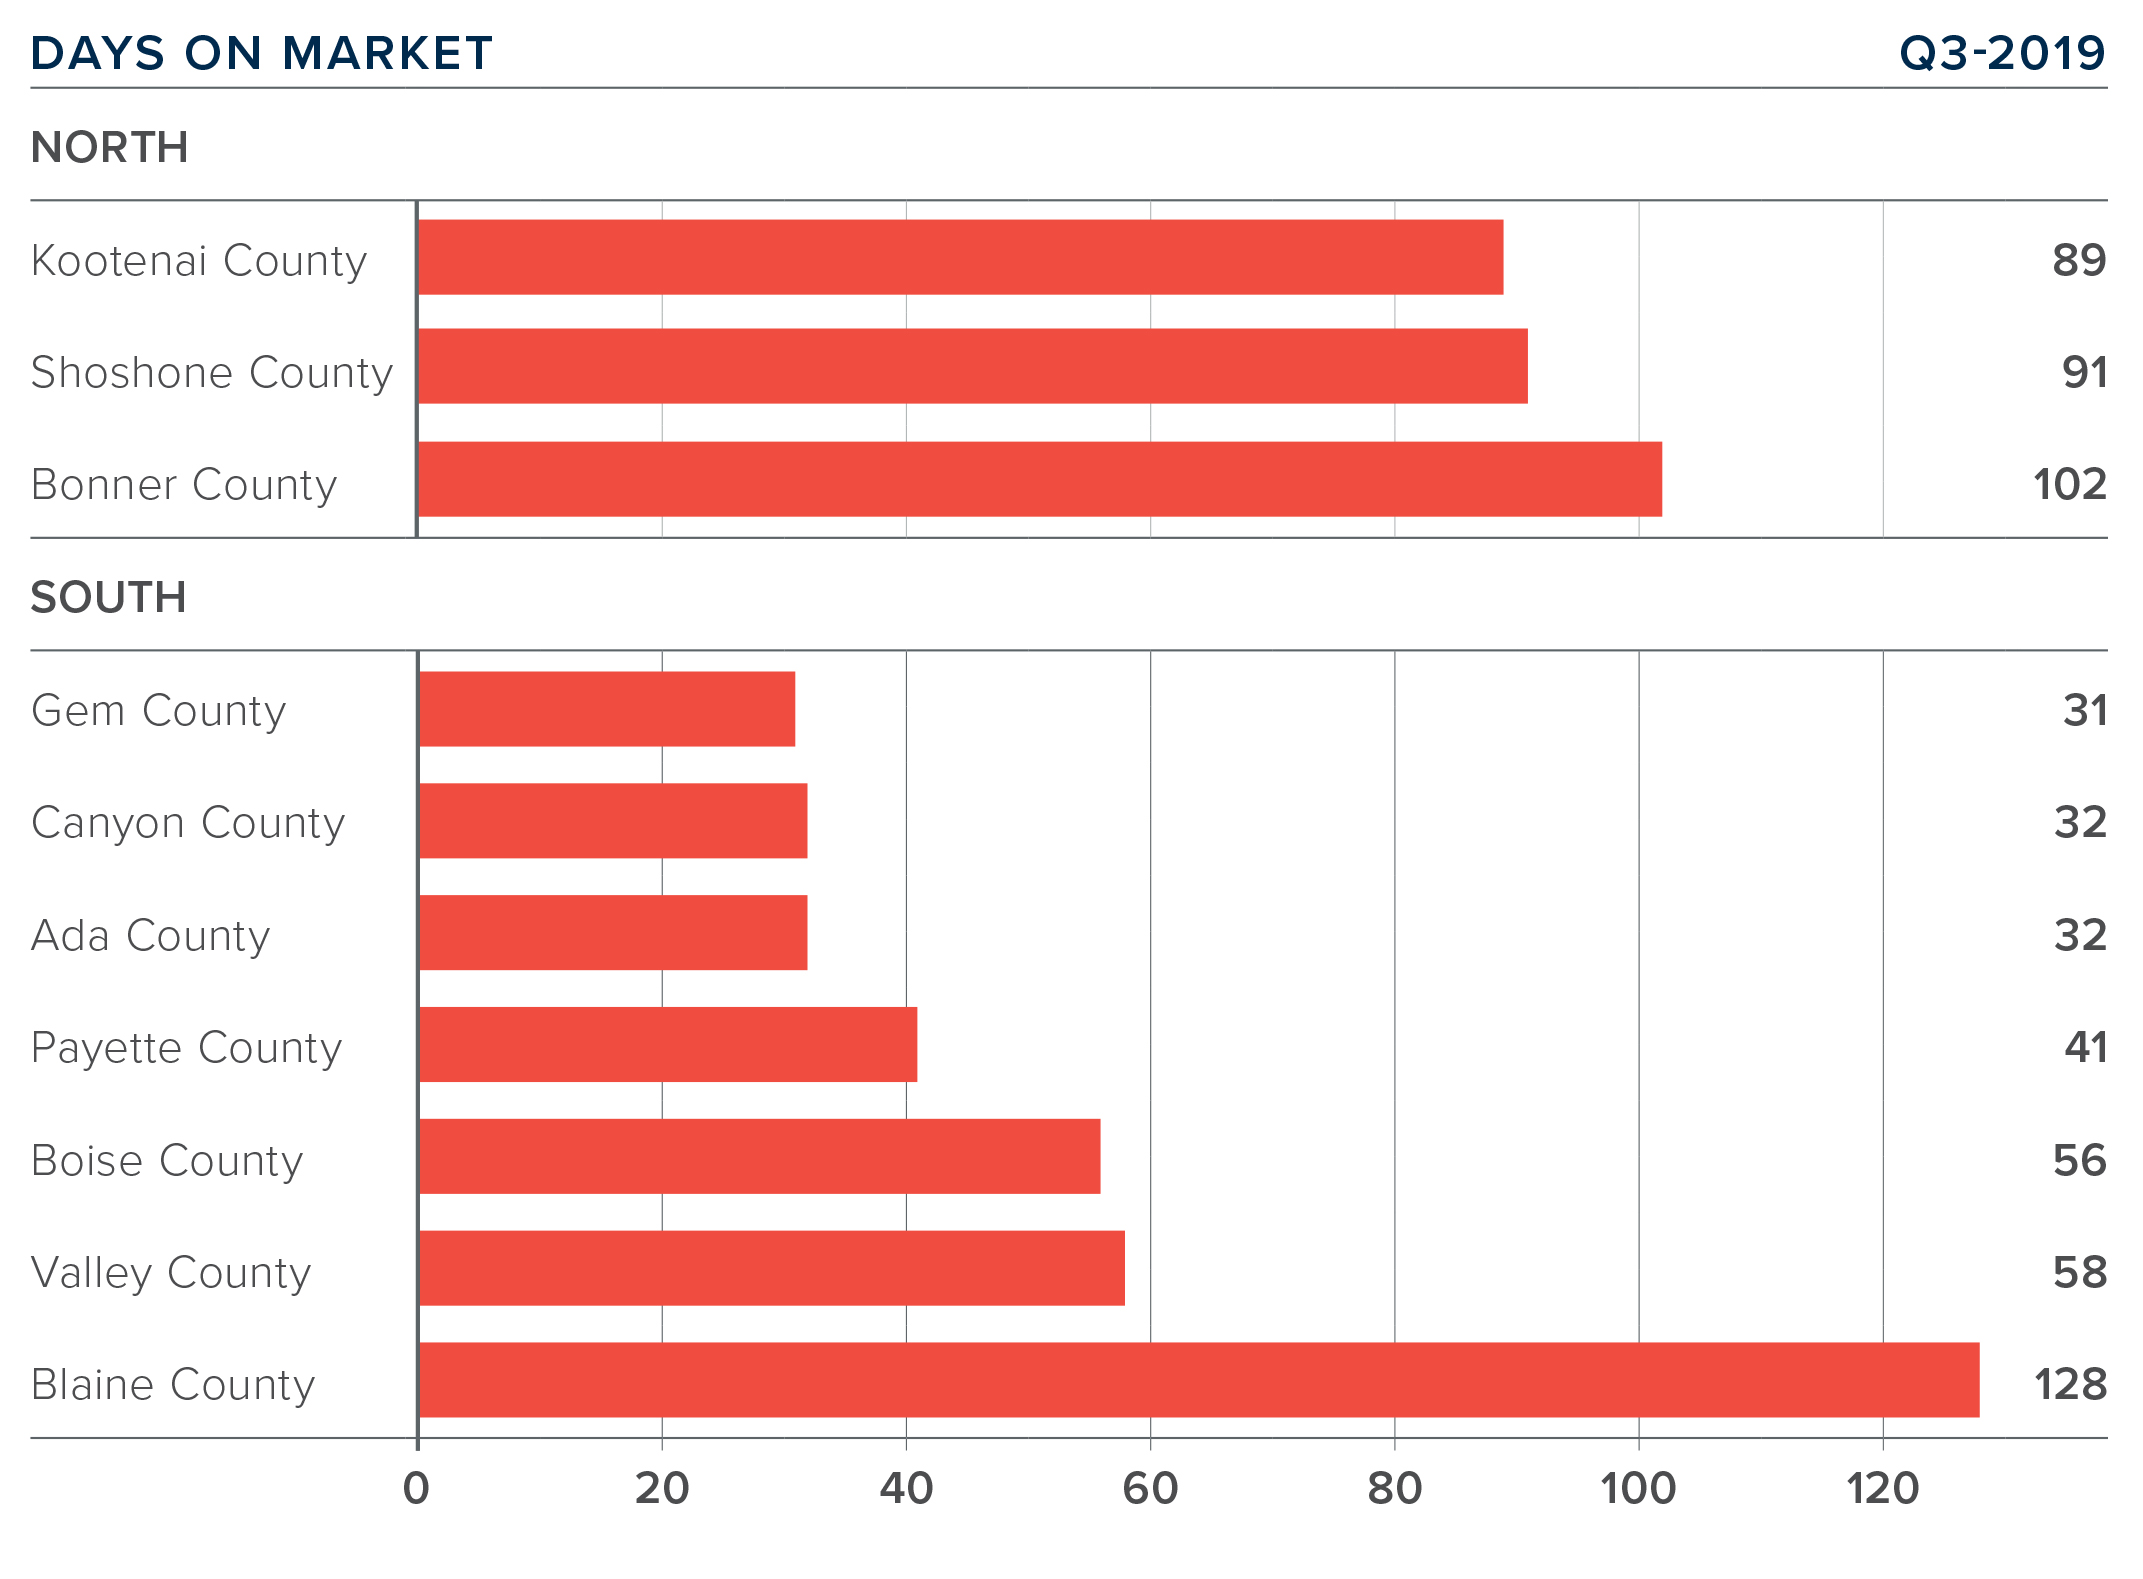
| ❱ It took an average of 94 days to sell a home in Northern Idaho, and 54 days in the southern part of the state.
❱ The average number of days it took to sell a home in the region dropped ten days compared to the third quarter of 2018. It was also ten days lower than in the second quarter of this year. |
❱ In Northern Idaho, days-on-market dropped across the board. In Southern Idaho, market time dropped in all counties except Ada and Canyon, though the rise in average market time was very modest.
❱ Homes sold the fastest in Gem, Canyon, and Ada counties. |
 |
 |
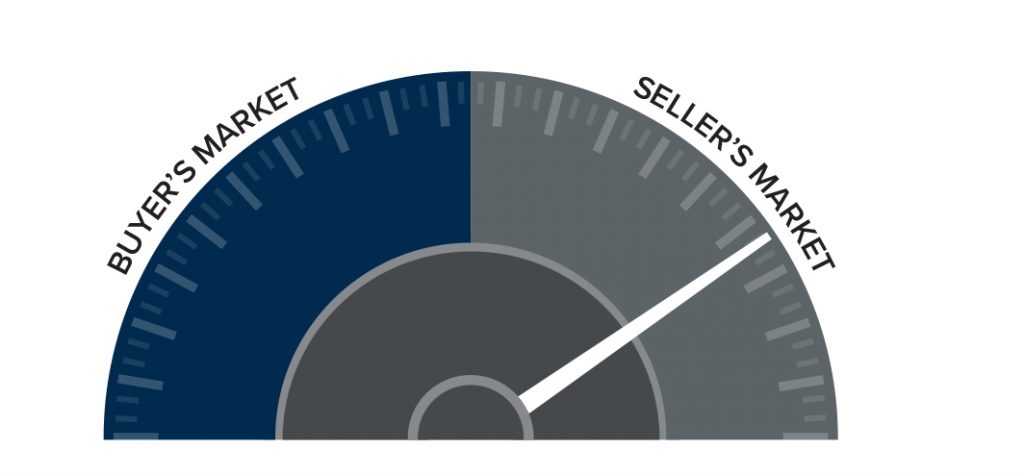
The speedometer reflects the state of the region’s housing market using housing inventory, price gains, home sales, interest rates, and larger economic factors.
Job growth continues to slow from the frenetic pace of the past few years but remains quite impressive. As is commonly known, economic/job growth leads to demand for homeownership and this continues to bode well for the Idaho market; however, home sales continue to be held back by a lack of inventory and this is leading to higher prices. As such, it remains a sellers’ market so I have moved the needle just a little more in their direction. ABOUT MATTHEW GARDNER Governors Council of Economic Advisors; chairs the Board of Trustees at the WA Center for Real Estate Research; and is an Advisory Board Member at the Runstad Center for Real Estate Studies at the University of Washington where he also lectures in real estate economics. |
|

 Facebook
 X
X
 Pinterest
 Copy Link
