 Facebook
 X
X
 Pinterest
 Copy Link
Economic Update for Idaho Real Estate Market

The following analysis of select counties of the Idaho real estate market is provided by Windermere Real Estate Chief Economist Matthew Gardner. We hope that this information may assist you with making better-informed real estate decisions. For further information about the housing market in your area, please don’t hesitate to contact your Windermere agent.
ECONOMIC OVERVIEW
Job growth in Idaho continues to moderate. The state added 19,400 new jobs over the past 12 months, representing an annual growth rate of 2.7%. That said, the growth rate remains well above the national average of 1.7%. In March, Idaho’s unemployment rate was 2.9%, matching the level seen a year ago. The state remains at full employment, and it’s worth noting that the employment rate remained below 3% even as the labor force rose by 2%. This suggests the economy remains very strong as there are still job openings to accommodate new workers. Idaho continues to outperform the nation in terms of economic vitality and will continue to do so for the balance of the year.
HOME SALES
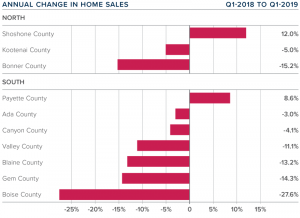
- 4,440 homes were sold during the first quarter of 2019, representing a drop of 4.3% compared to the first quarter of 2018.
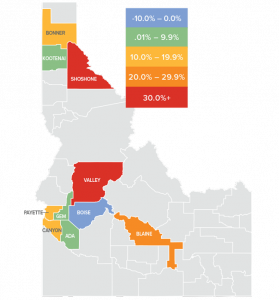
- In Northern Idaho, Shoshone County was alone in experiencing sales growth, with an increase of 12% over the first quarter of 2018. There was a substantial drop of more than 15% in Bonner County, but this is a small area, making it prone to significant swings. In Southern Idaho, we saw modest sales growth in Payette County, modest declines in Canyon and Ada counties, and significantly lower sales in the small area of Boise County.
- Year-over-year sales growth was positive in just one Northern Idaho market, and only one of the Southern Idaho markets saw sales rise relative to the same period a year ago.
- When compared to the first quarter of 2018, the number of homes for sale was lower across the board in Northern Idaho and in most Southern Idaho market areas. It’s likely that this contributed to the decline in sales.
April 2019 Market Statistics & New Construction Update
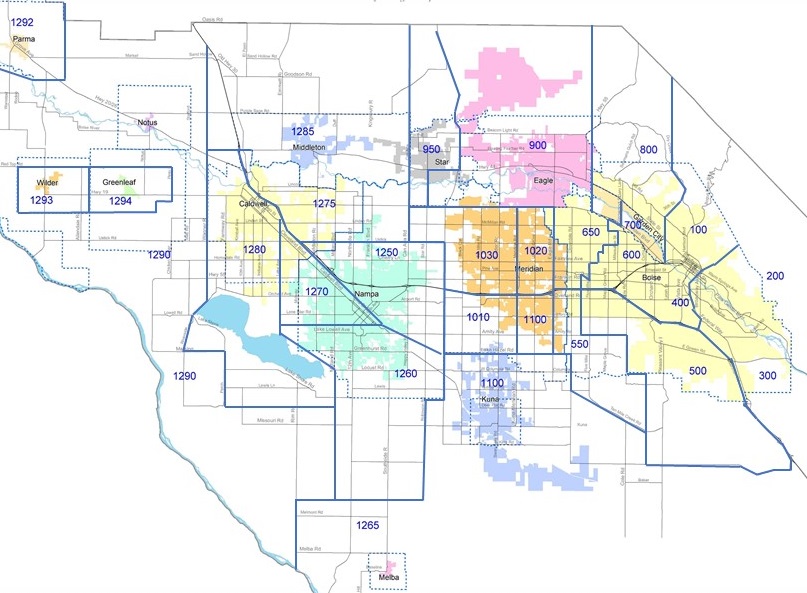
The 2019 Ada County Parade of Homes is wrapping up this weekend. Since 1956 this annual event puts new home construction trends to the forefront. From decor to architecture style, visitors on the Parade take notice and compare to previous trends. This time of year we get the most questions about new home construction in the Treasure Valley. With Idaho’s population increase of 2.1 % in 2018, one of the second fastest growing states, and Boise is showing up on a Top Ten list at least once a month, we are getting more questions than ever. This growth means an abundance of new residential construction and we wanted to share more information with you.
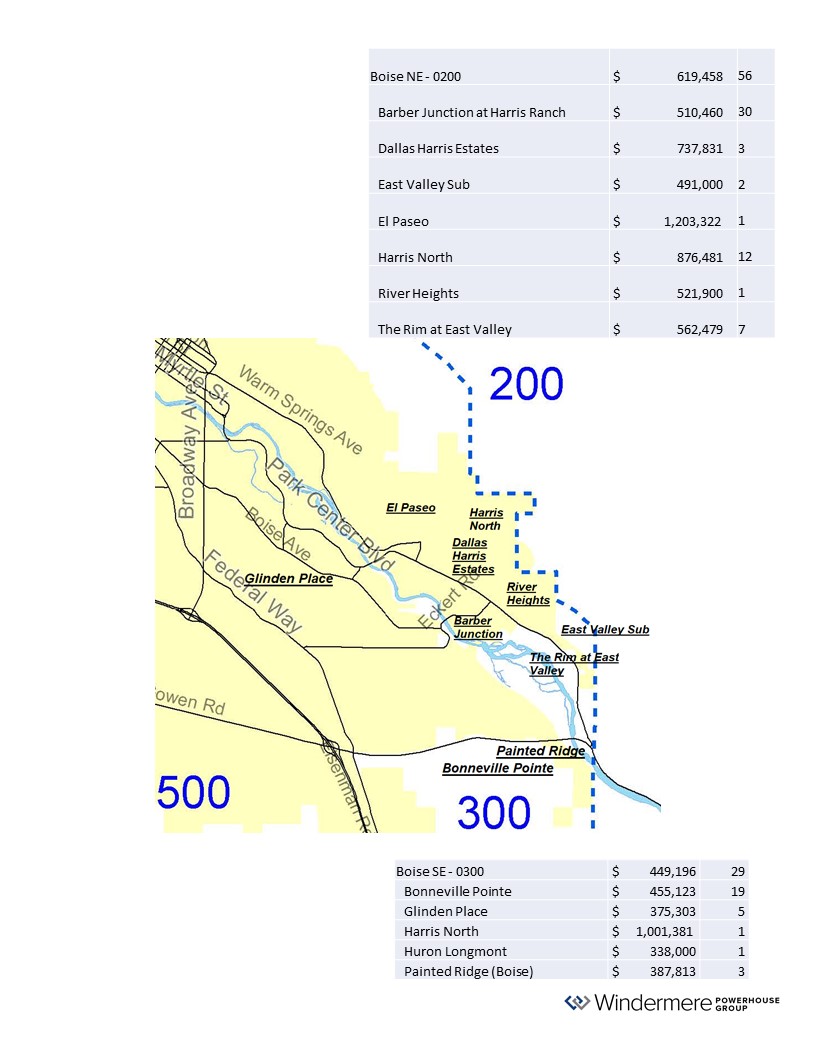
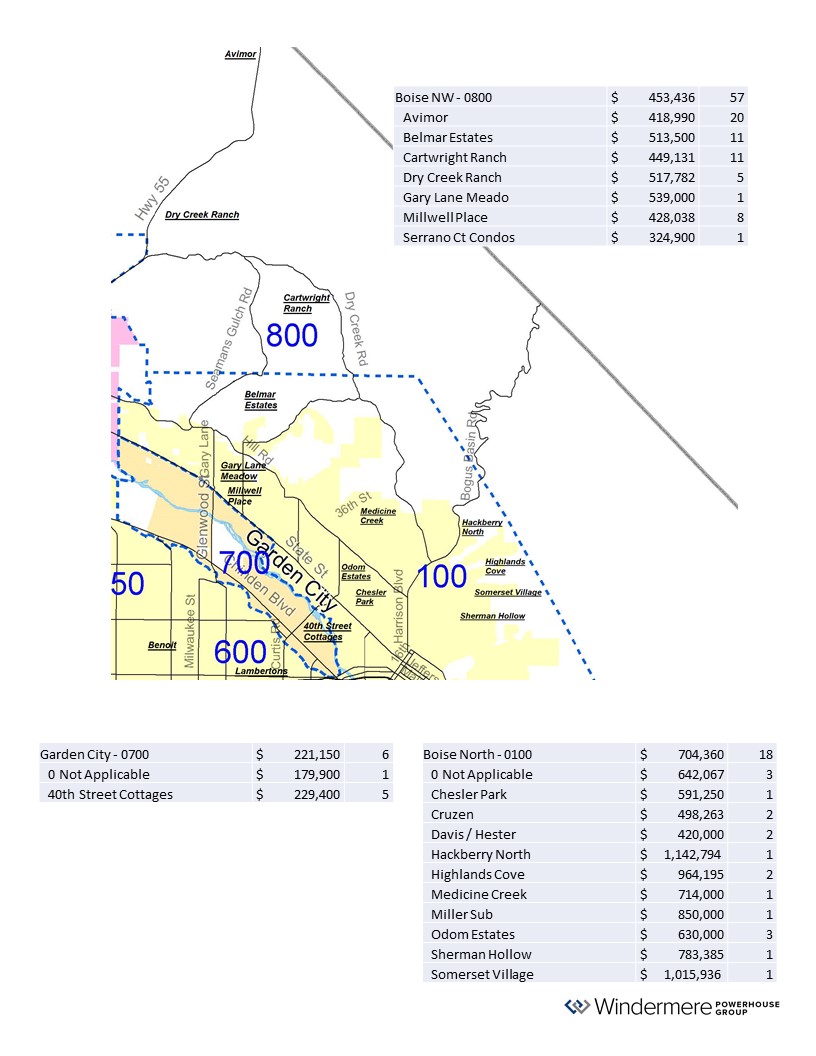
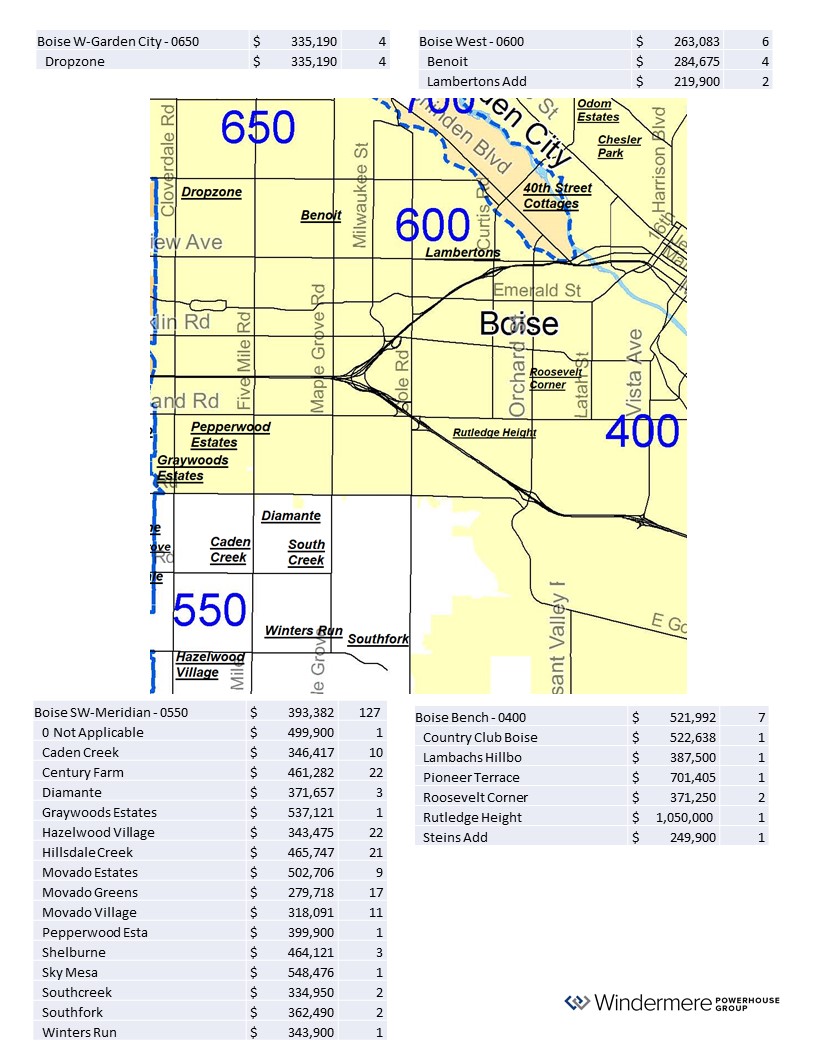
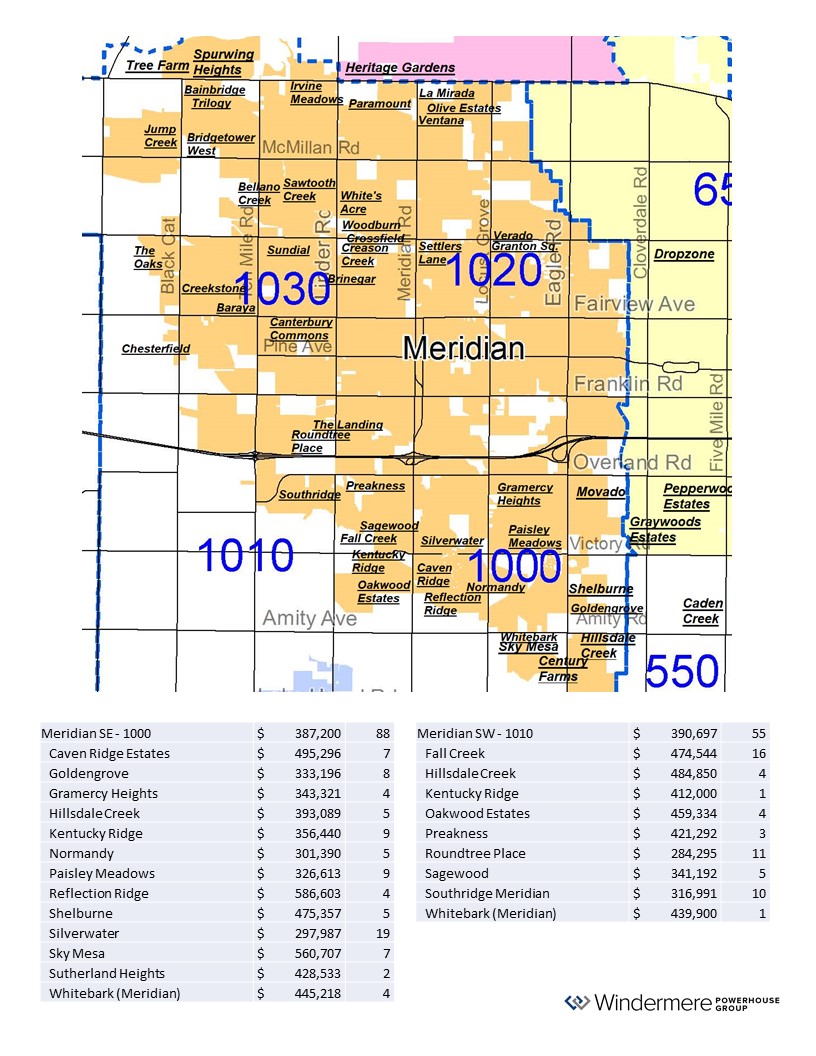
Below are maps and an accompanying report for new construction home sales in Ada County broken down by subdivision and price. Click on the thumbnail to see a full size map and report. Be sure to ask our agents for supplementary detail if desire more than a snapshot. They’re equipped to share detailed information within each submarket, by price point or size of home, so that you can make the best buying or selling decision for you.
NE Boise & SE Boise N & NW Boise/Garden City W & SW Boise/Boise Bench
Eagle & Star SE & SW Meridian NE & NW Meridian


Don’t forget to check out the Canyon County Parade of Homes June 7-June 23, 2019 and or get detailed information on Canyon County broken down by subdivision and price.
Full market statistics reports on Ada and Canyon County
April 2019 Ada Existing Homes Sales
April 2019 Ada New Construction Sales
April 2019 Canyon Existing Sales
April 2019 Canyon New Construction Sales
