 Facebook
 Twitter
 Pinterest
 Copy Link
Economic & Housing Forecast presented by Matthew Gardner

Save the Date
January 30, 2020 10 am- 12 pm
You are invited to join us as Matthew Gardner, Chief Economist for Windermere, presents a 2020 Economic and Housing Forecast for Idaho on January 30, 2020, 10 am – 12 pm at JUMP in Downtown Boise.
Matthew is responsible for analyzing and interpreting economic data and its impact on the real estate market on both a local and national level. regularly speaks at events around the country, is frequently quoted in the media in stories and publishes the Gardner Report, which highlights market conditions in regions throughout the Western U.S. View the 3rd Quarter 2019 Idaho Report here.
Please contact us if you are interested in attending or learning more about the upcoming event. PowerhouseGroup@Windermere.com or 208-920-5966.
Idaho 2019 3rd Quarter Real Estate Economic Report
 |
The following analysis of select counties of the Idaho real estate market is provided by Windermere Real Estate Chief Economist Matthew Gardner. We hope that this information may assist you with making better-informed real estate decisions. For further information about the housing market in your area, please don’t hesitate to contact us.
ECONOMIC OVERVIEW In August, the state unemployment rate was 2.9%, marginally higher than the 2.8% rate a year ago. It cannot be disputed that the state remains at full employment. It’s also interesting to note that the employment rate remained below 3% even as the labor force rose by 2.2%, suggesting that the economy remains very strong and new entrants to the labor force are finding jobs relatively easily. |
|
|
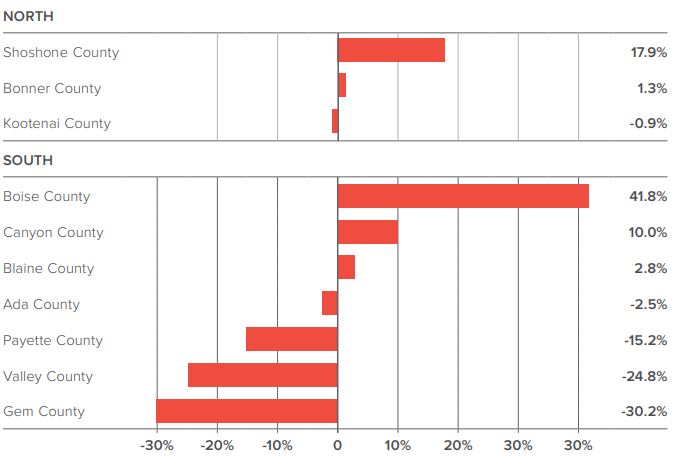
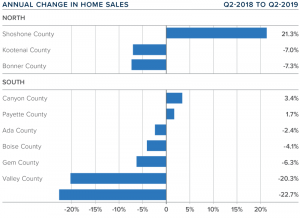
| HOME SALES | ANNUAL CHANGE IN HOME SALES Q3-2018 TO Q3-2019 |
| ❱ During the third quarter, 7,342 homes sold, representing a modest drop of 3.4% compared to the third quarter of 2018.
❱ In Northern Idaho, Shoshone County experienced a 17.9% increase in sales over the third quarter of 2018. There was a modest increase in Bonner County and a very slight contraction in Kootenai County. In Southern Idaho, sales jumped in Boise and Canyon counties. Blaine County also saw a slight increase, but sales activity was lower in the rest ❱ Year-over-year sales growth was positive in two Northern Idaho counties and three Southern Idaho counties. ❱ Pending sales rose in the third quarter, suggesting that closed sales in the final quarter of this year are likely to be an improvement over current figures. |
 |
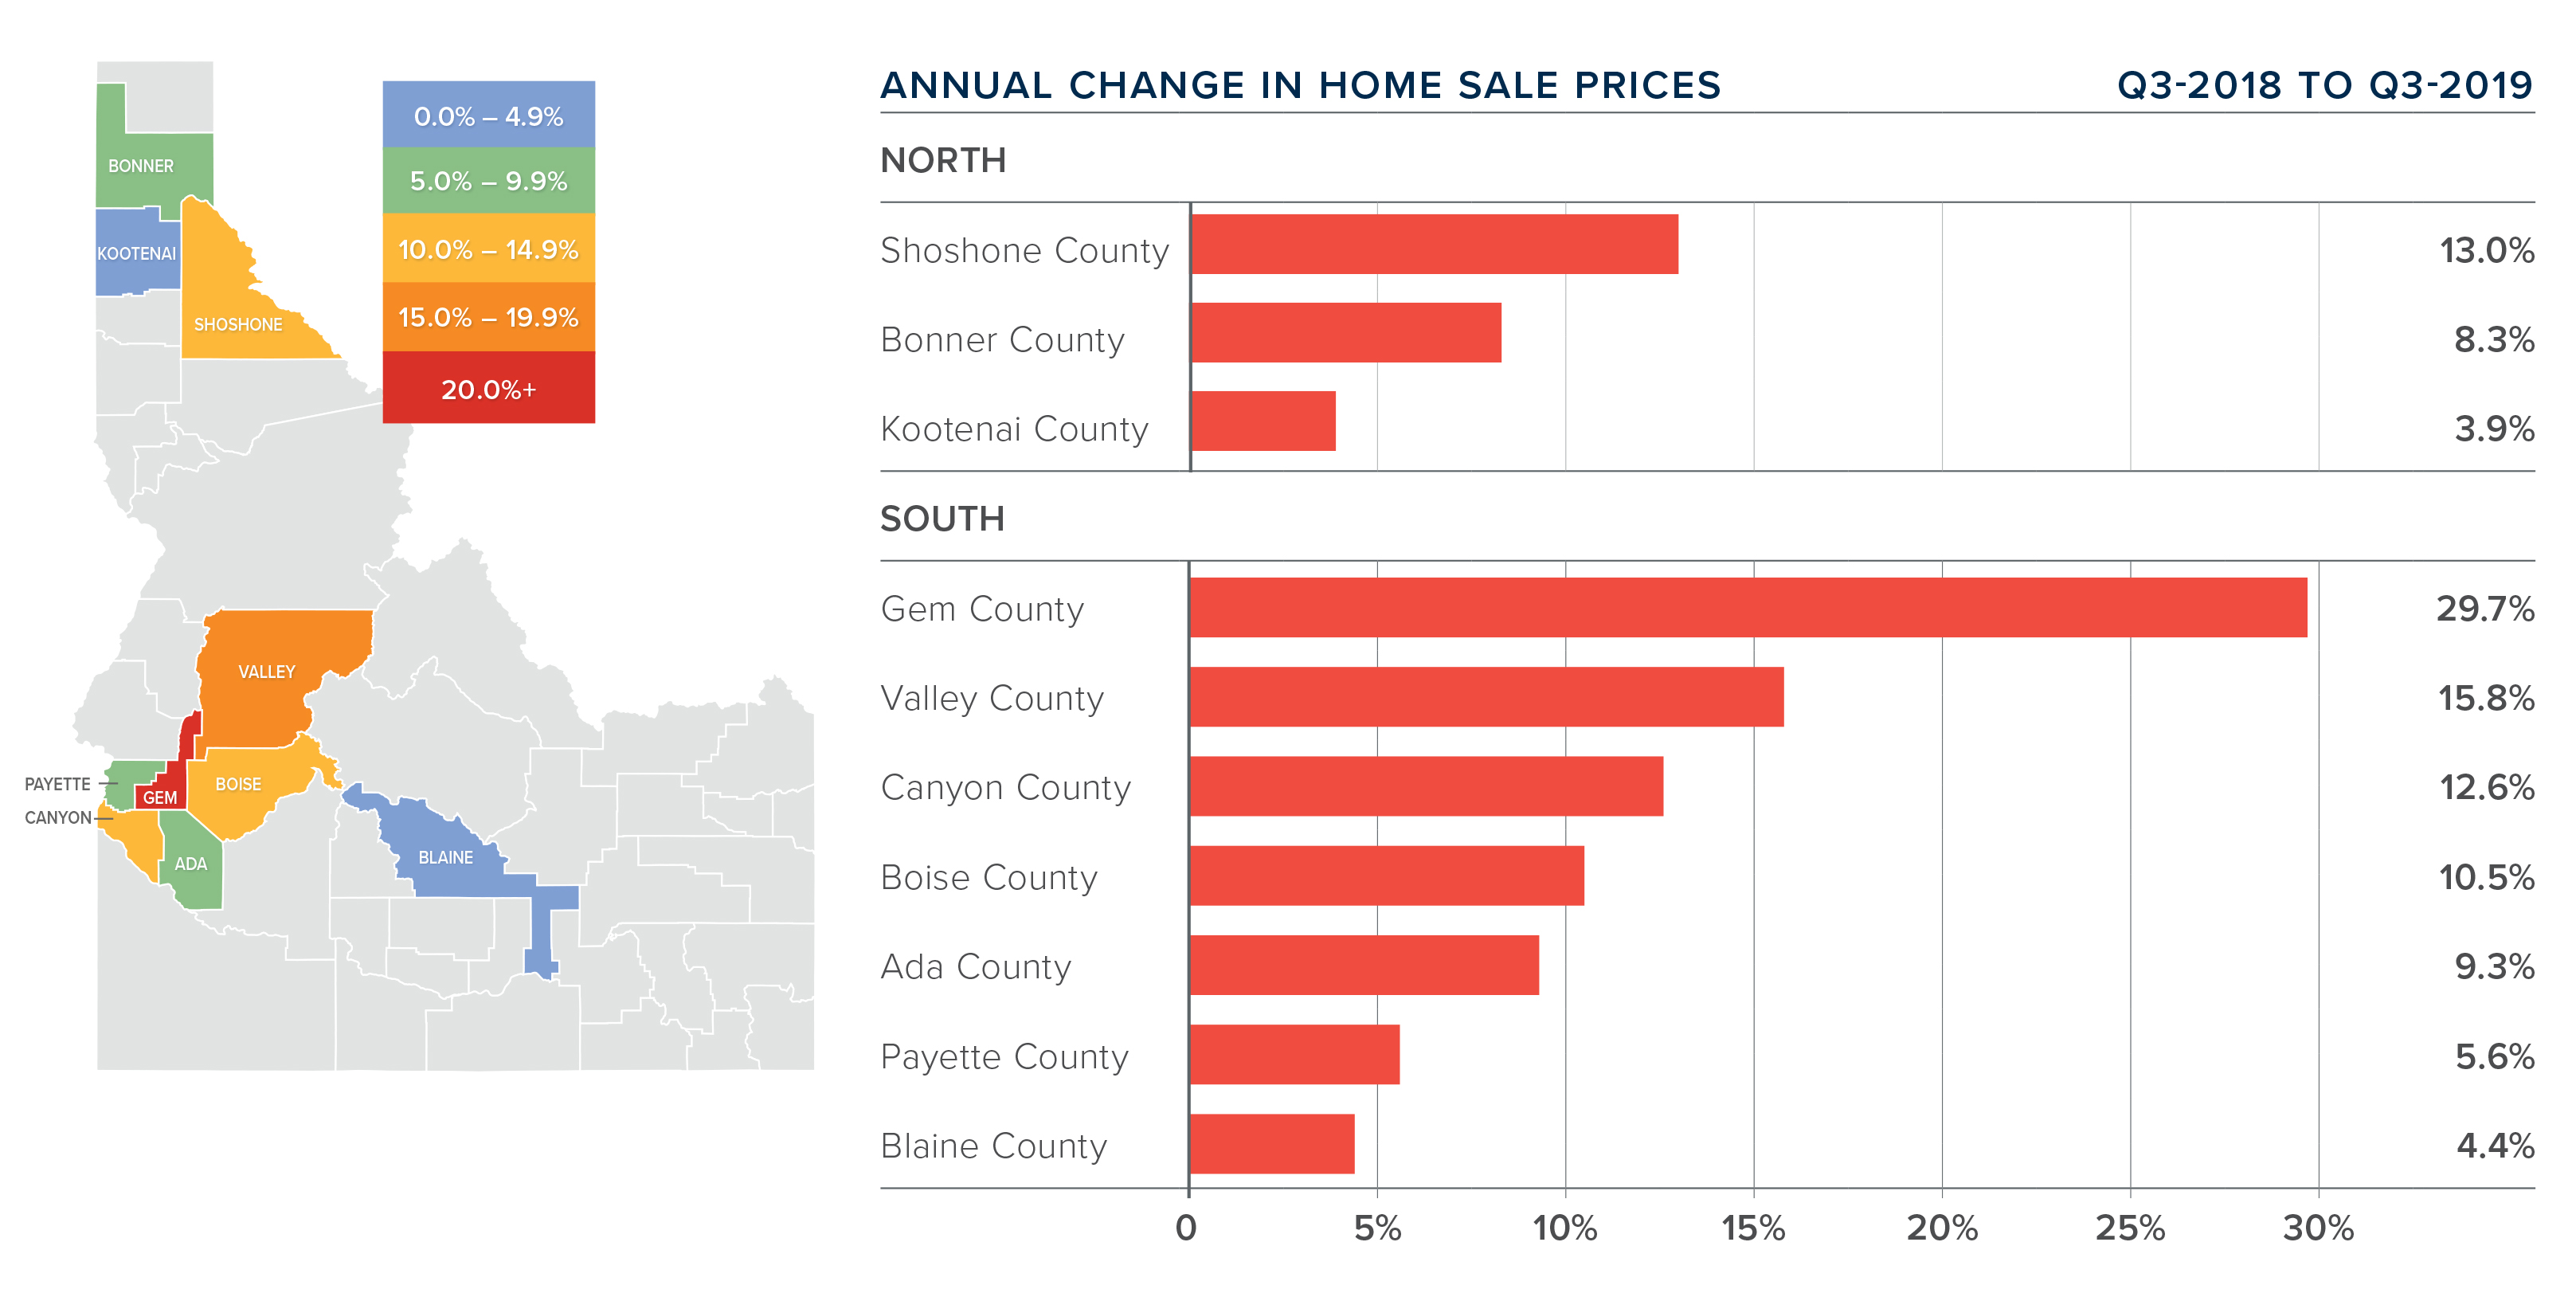
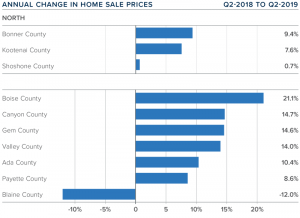
HOME PRICES
| ❱ The average home price in the region rose 8% year-over-year to $367,963. Prices were 2.7% higher than in the second quarter of this year. ❱ Prices rose in all counties compared to the third quarter of 2018. |
❱ In Northern Idaho, Shoshone County led the market with the strongest annual price growth. Bonner County also had solid price growth. In Southern Idaho, Gem County saw prices rise a very significant 29.7%, and there were notable increases in Valley, Canyon, and Boise counties. | ❱ Inventory continues to be an issue. The number of homes for sale is down 3.4% compared to the third quarter of 2018. Although listings are up 7% over the second quarter, the market remains very tight, and this is pushing prices higher. |
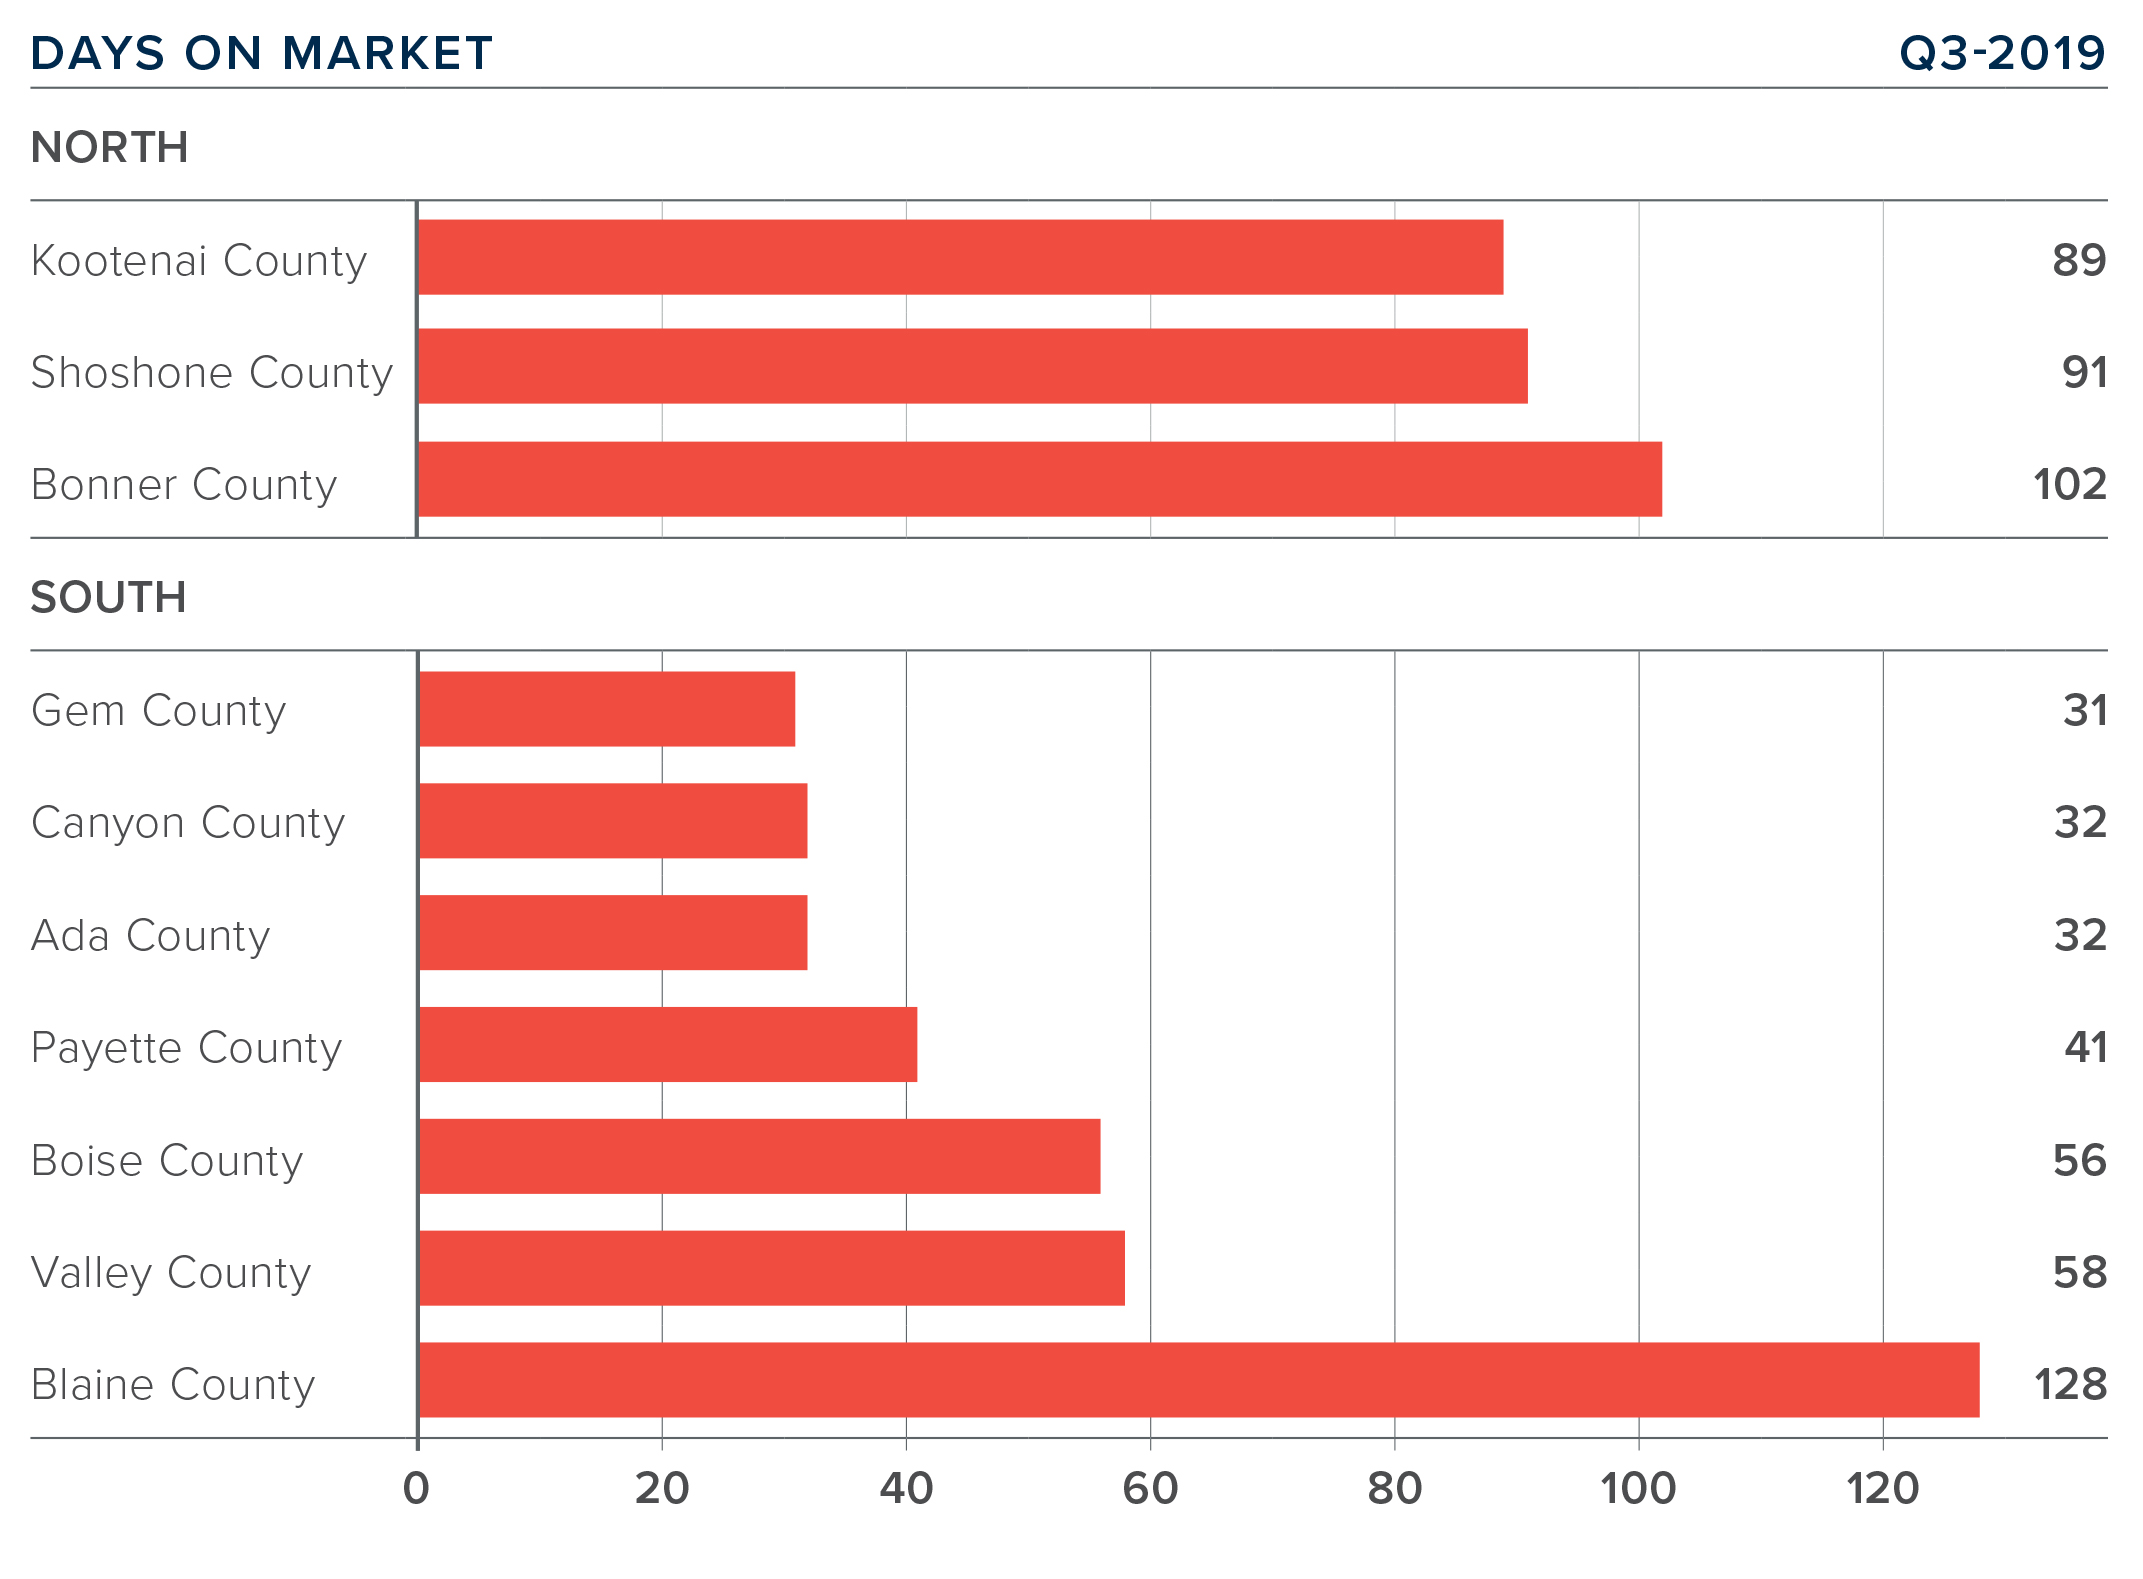
| ❱ It took an average of 94 days to sell a home in Northern Idaho, and 54 days in the southern part of the state.
❱ The average number of days it took to sell a home in the region dropped ten days compared to the third quarter of 2018. It was also ten days lower than in the second quarter of this year. |
❱ In Northern Idaho, days-on-market dropped across the board. In Southern Idaho, market time dropped in all counties except Ada and Canyon, though the rise in average market time was very modest.
❱ Homes sold the fastest in Gem, Canyon, and Ada counties. |
 |
 |
The speedometer reflects the state of the region’s housing market using housing inventory, price gains, home sales, interest rates, and larger economic factors.
Job growth continues to slow from the frenetic pace of the past few years but remains quite impressive. As is commonly known, economic/job growth leads to demand for homeownership and this continues to bode well for the Idaho market; however, home sales continue to be held back by a lack of inventory and this is leading to higher prices. As such, it remains a sellers’ market so I have moved the needle just a little more in their direction. ABOUT MATTHEW GARDNER Governors Council of Economic Advisors; chairs the Board of Trustees at the WA Center for Real Estate Research; and is an Advisory Board Member at the Runstad Center for Real Estate Studies at the University of Washington where he also lectures in real estate economics. |
|
Idaho Economic Market Report

The following analysis of select counties of the Idaho real estate market is provided by Windermere Real Estate Chief Economist Matthew Gardner. We hope that this information may assist you with making better-informed real estate decisions. For further information about the housing market in your area, please don’t hesitate to contact our office.
ECONOMIC OVERVIEW
Following a trend that started last fall, job growth in Idaho continues to moderate. The addition of 18,400 new jobs year-over-year represents an annual growth rate of 2.5%. This is to be expected at this point in the economic cycle, but it’s worth noting that the current rate of job growth remains well above the national average of 1.6%.
In May, the state unemployment rate was 2.8%, marginally lower than the 2.9% rate of a year ago. The state remains at full employment, though it is interesting to note that the employment rate remained below 3% even as the labor force rose 2%, suggesting that the economy remains very robust as there are still job openings to accommodate new workers.
HOME SALES
- 6,936 homes were sold during the second quarter of 2019, representing a modest drop of 2.8% from the second quarter of 2018.
- In Northern Idaho, Shoshone County was the only county to experience sales growth, with sales up by 21.3% over the second quarter of 2018. There was a modest decline in sales in the other two counties. In Southern Idaho, Canyon and Payette counties had modest sales growth, but the rest of the region experienced lower sales activity.
- Year-over-year sales growth was positive in just one of the Northern Idaho counties. Sales rose in two Southern Idaho market areas relative to the same period a year ago.
- Pending sales rose in the quarter, suggesting that closed sales next quarter are likely to be an improvement over current figures.
HOME PRICES
- The average home price in the region rose 7.8% year-over-year to $358,406 and was 3.2% higher than the first quarter of this year. Continue reading…..
March 2019 Treasure Valley Real Estate Market Statistics
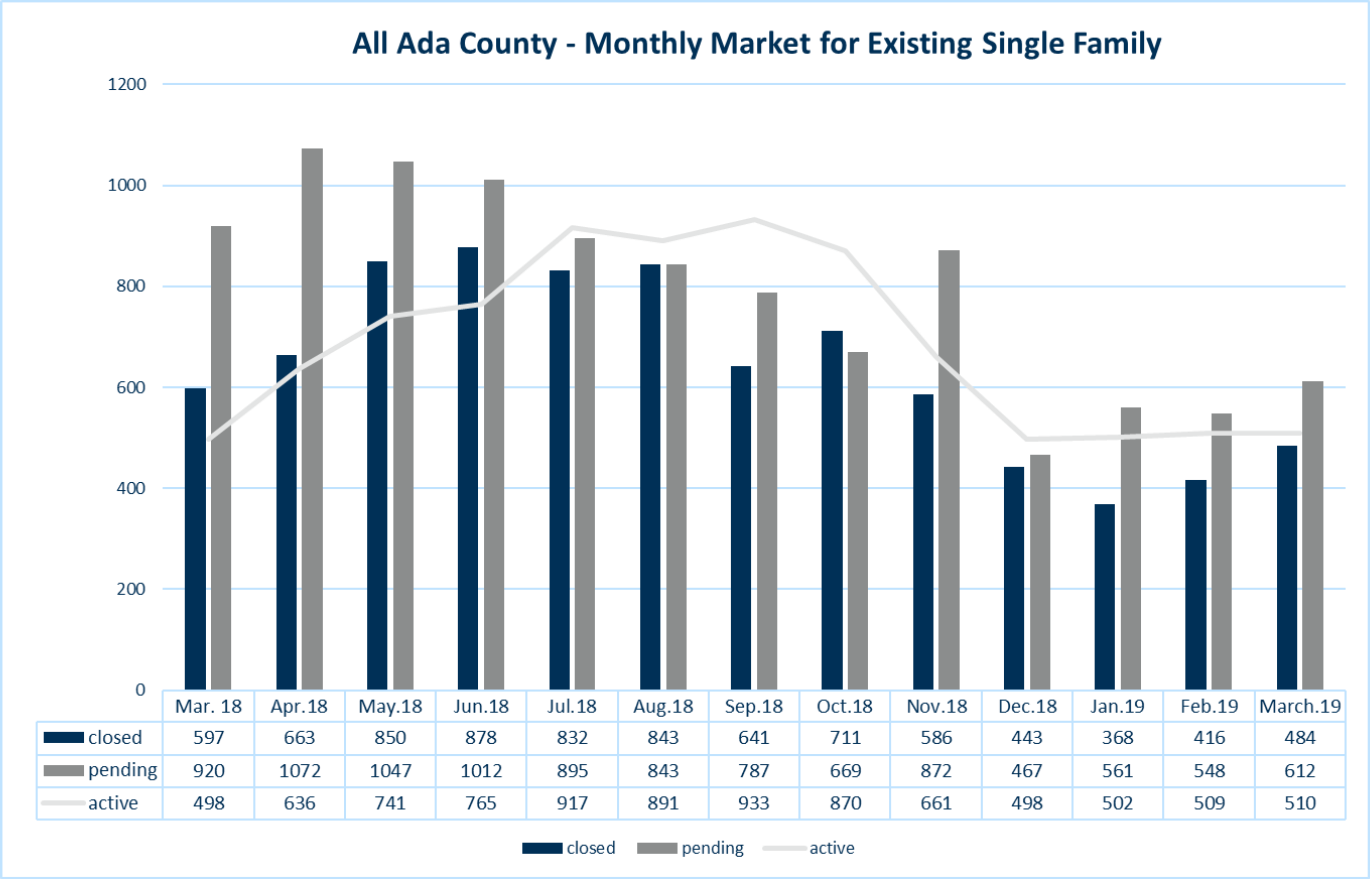
“How’s the market?” is the one question that Windermere Agents get asked most. It is the same question we ask when we meet an agent from another state. It’s a simple question with a very complex answer. Windermere Powerhouse Group knows how important it is to understand our real estate market and how curious everyone is to know what is going on in our community. So we created a market snapshot and a detailed report for every area of the Treasure Valley that will be posted monthly here on our Blog. This month we are featuring Ada County Existing Home Sales (i.e., greater than 1 year old). Links for other areas and detailed reports are below.
1. Spring and summer are historically the seasons when market activity increases. More homes are available for sale, and under the current market dynamics, demand immediately follows. Total Year-to-Date (YTD) 2019 transactions are down from 2018, and the shortage of supply is a major contributor. As you’ll see below, overall prices continue to increase yet days-on-market remain at historically low levels. If you are interested in buying or selling your house now is the perfect time to take action.
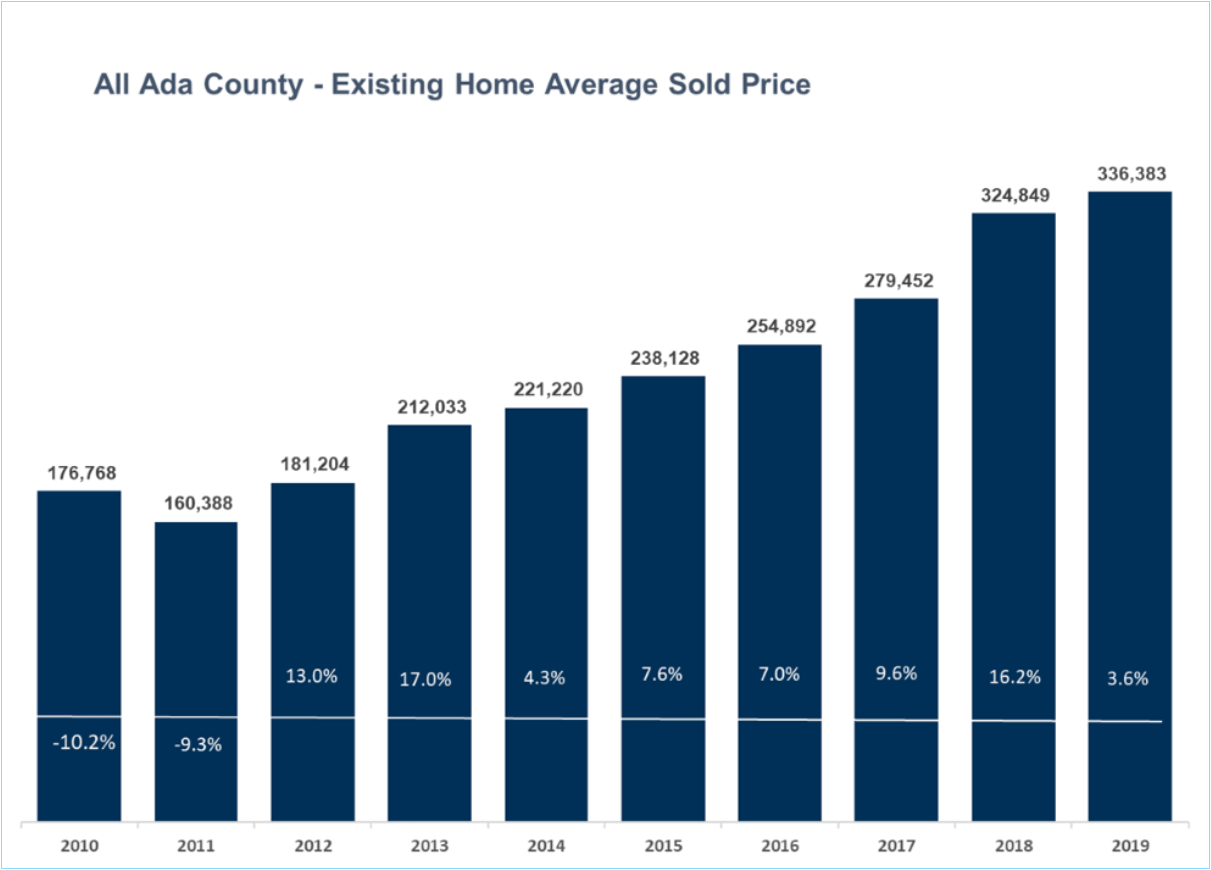
2. Existing home prices have risen every year since 2011 and have taken a substantial increase in the last several years. Average prices for Ada County existing homes have continued to climb in 2019, currently up 3.6%. Windermere Real Estate’s in-house economist, Matthew Gardner, forecasts 2019 Home Price growth to be 4.5% nationally, 8.9% in Ada County and 8.1% in Canyon County. So it’s actually a safe time to buy or sell a home too. Gardner forecasts the number of Ada County households to increase by 11.1% over five years, while Canyon County by 13.3% growth.
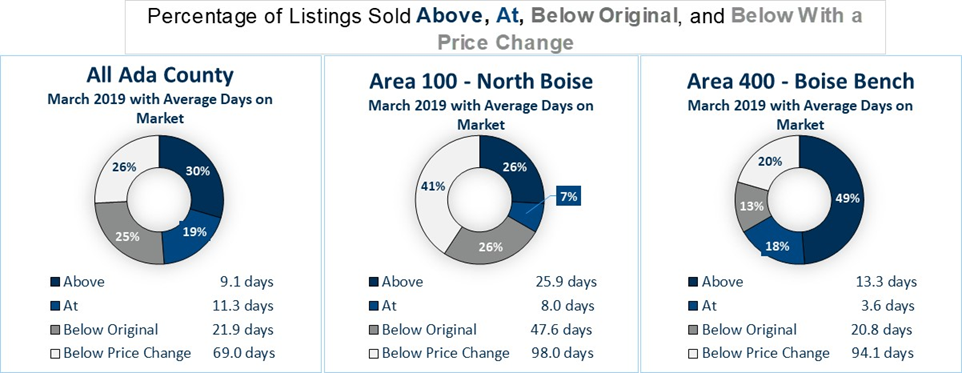
3. Last March, nearly half the existing Ada County homes that sold closed “At” or “Above” the original asking price. However, that trend varies greatly throughout the Treasure Valley. The graphs above show a snapshot of the Ada County averages compared to the North End and Boise Bench. There are numerous factors affecting a home’s price, and it’s evident that overpriced houses cost their sellers 2-3 mortgage payments last month. Specific neighborhoods have their own unique characteristics, and the REALTORS® at Windermere Powerhouse Group each possess the expertise and data to lead your next real estate transaction.
If you’d like more detailed information, have interest in learning more or would like a thorough valuation of your current home, we’d love to hear from you.
Specialized Areas and Construction Types
Ada County Existing Sales March 2019
Ada County New Construction March 2019
Canyon County Existing Sales March 2019
Canyon County New Construction March 2019
Your Neighborhood
